Fancy Stats: The Championship so far

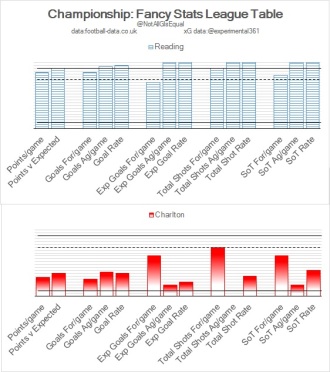
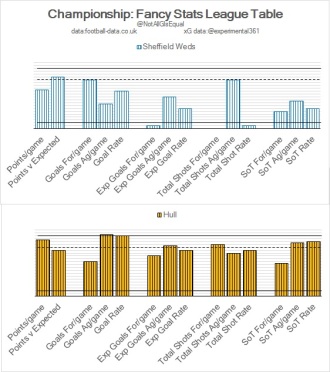
I have been playing about with different ways of presenting team level Championship stats in recent weeks, and settled on the following approach (for now anyway); the Fancy Stat League Table.

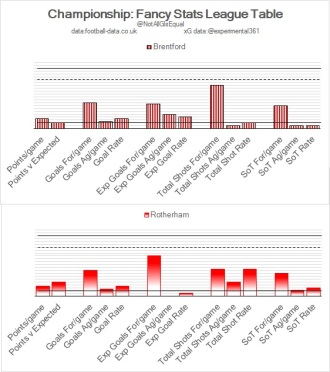
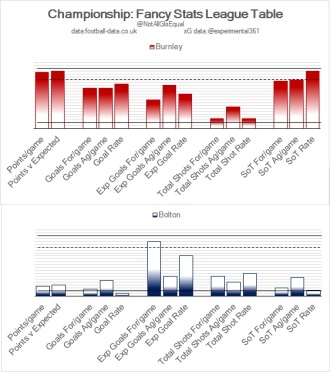
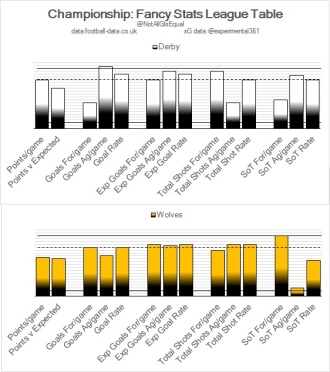
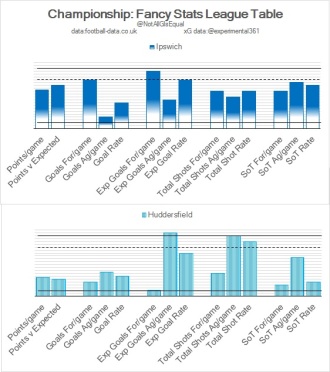
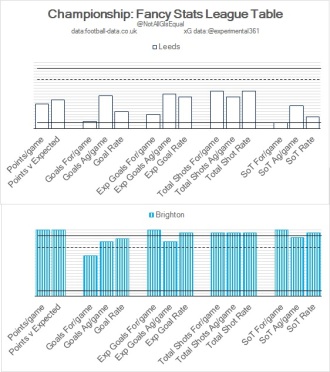
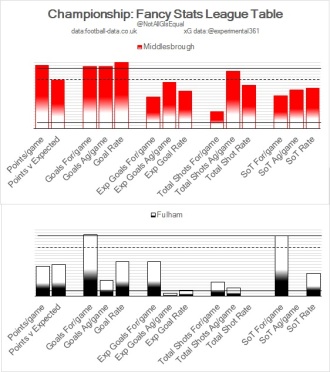
These tables show the rank of a team for particular metrics – the higher the rank (or taller the bar), the better a team has performed in that metric compared to their rivals.  An important limitation of these tables is that they provide no scale to the stats presented; Brighton sit one place above Middlesborough in terms of points per game, but by how much?  The tables don’t tell you that.

So, why this approach?

Well, I think (hope) they are easy on the eye.  The majority understand a league table and, personally, I find that the quicker I can understand a graphic, the better the graphic.

I did mess about with graphics displaying the raw numbers but unless you know the typical range of the metrics presented, this approach probably wouldn’t mean too much.  Feel free to recommend alternative approaches, I’m all ears.

Anyway, here’s how all teams have performed so far, presented in the context of this weekend’s fixtures, but first a few words on each metric.

Points/game – this replicates actual league position

Points v Expected – this provides a view of performance in terms of bookies’ expectation, and provides an indication of over/under performance

Actual goals – for, against, and rate (for/total goals) – goal rate correlates very well to league position at the end of a season

Expected goals – as for actual goals but this provides some context in terms of the quality of chances taken and conceded.  This is based on the excellent Ben Mayhew’s model which you can read more about on his blog – go check it out, there’s loads of great analysis across England’s professional game.

Finally Shots, total and on target – again these correlate well to final positioning however treat with caution, score effects, particularly at close game states (where a team is leading or trailing by 1 goal), and strength of schedule can skew these figures.

I’m looking forward to see how teams perform over the season and observe any regression.  I hope also, at some point, to introduce form tables.

Final note, and a generalisation which may be worth exploring further; tables which are left hand heavy (points and goals) may suggest a level of over-performance, right hand heavy (expected goals and shots) might identify teams that deserve a break.
4.BCvNF
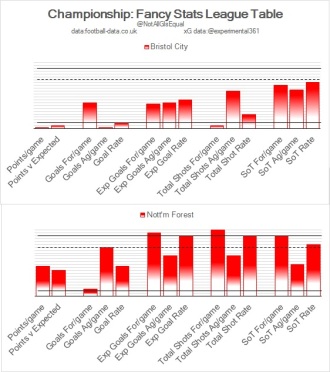
Two teams due a positive bounce. Bristol City performing better than their save % suggests, Forest due some fortune in front of goal
4.BCvQPR
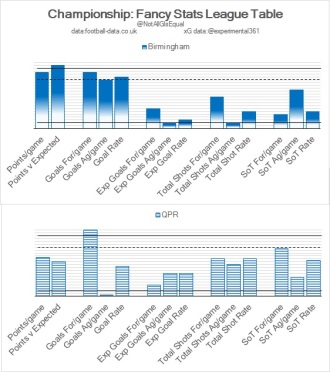
Oh QPR, you pain me – Looking very ordinary and that variation in goals scored v expected is worrying. Birmingham’s results to date look unsustainable
4.BrevRot
Two teams that, if continue in this vain, are in for a tough season
4.BurvBol
Burnley very precise with their shooting, but it will be interesting to see how sustainable their performance is given low total shot rate. Bolton look like they are creating good chances but been unfortunate in front of goal.
4.DervWol
Derby creating good chances but having difficulty turning shots into SoTs. Opposite true in terms of shots conceded. Wolves may encourage a reverse  in this trend giving up few shots but with a high percentage on target
4.IpvHud
Score effects likely to be flattering Huddersfield somewhat but need to improve in attack if going to climb the table.                                                                     Ipswich may struggle to reach heights of last season but looking better going forward than in defence.


4.LeevBri
Brighton, Look, Impressive! They are roughly 6 shots (2 SoT) better of than their opponents per game; I’ll be watching their score rate keenly, which is relatively low. Leeds look mid-table at best.
4.MidvFul
Score effects likely to be underselling ‘Boro here having only found themselves trailing by a goal in 2 games so far. Only Brighton are posting more SoT/game than Fulham who might find themselves in the league’s gutter if they can’t sustain such shooting precision
4.MKvBla
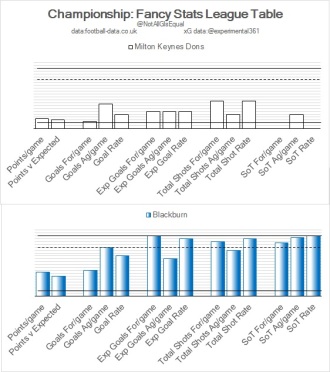
Blackburn are posting good numbers and may be a force if their scoring percentage can take off in time. The Dons numbers don’t suggest they will be seeing a resurgence.
4.PrevCar
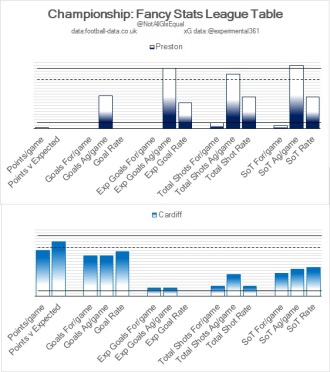
I suspect Preston games have seen battle after battle in midfield this season; giving little up in the final third and hardly threatening in attack. Cardiff results possibly flatter so far.
4.ReavCha
That 6/1 for Reading to be promoted just 3 weeks ago looks massive right now; probably best described as one way traffic. Charlton are enthusiastic in attack, but won’t be anything other than a participant unless improve defensively.
4.SWvHull
Wednesday look like they are dining out on an unsustainable score rate at present, while Hull are living up to expectations as strong Play-off contenders


Leave a comment